January 12, 2026
OOH Measurement Made Simple: How to Read, Understand & Decode Your Digital Out-of-Home Campaign Data
Picture this: you’re strolling through a lively city street, and suddenly a bright billboard or glowing screen catches your eye with a fun message or cool image. That’s the magic of Out-of-home (OOH) ads, they pop up in the real world, on billboards, bus stops, or digital screens, grabbing attention when you’re out and about. And get this: 77% of people say they pay more attention to their surroundings now than before the pandemic, making DOOH a perfect way to connect with folks who are actually looking around.
But in our world of numbers and results, a pretty ad isn’t enough anymore. Smart brands want to know: Did people notice it? Did it make them think differently about the product? Did it lead to more store visits or online searches? That’s where checking your ad’s success comes in, it turns guesses into clear wins backed by measurable data.
Why OOH Was Hard To Measure
For years, most OOH decisions were based on rough estimates, manual traffic counts, or whatever numbers the media owner provided, with little transparency or standardization. Meanwhile, digital channels trained marketers to expect live dashboards, CTRs, and conversion reports for every campaign, making DOOH feel vague by comparison.
Today, OOH screens generate rich data: hourly impressions, movement patterns from aggregated mobile location signals, and exposure curves by time of day and location. The challenge is no longer data scarcity, but helping marketers turn these numbers into clear answers about reach, frequency, and brand impact.
This article breaks down exactly how to understand your OOH campaign data from impressions to brand lift, and how Moving Walls Measure and Moving Walls Science together take it even further.
The OOH Measurement Framework
Modern OOH measurement now follows a structure similar to digital campaigns, focusing on exposure, audience, and performance. Understanding these three layers helps you see campaign results beyond individual numbers.
Exposure metrics
Exposure tells you how many times people were likely to see your ad, similar to impressions in digital. It is typically modelled using:
- Footfall around each screen or site (pedestrian and vehicle flows).
- Screen characteristics like size, height, angle, and visibility.
- Aggregated mobile movement data to estimate passersby
Key terms:
- Impressions: Total estimated number of times your ad could be viewed (one person seeing it ten times counts as ten impressions)
- Reach: The number of unique people estimated to have seen your ad at least once.
- Frequency: Average number of times each reached person saw your ad (impressions ÷ reach).
- Cost per impression (CPI): Total campaign cost divided by total impressions, showing how efficiently you’re buying attention.
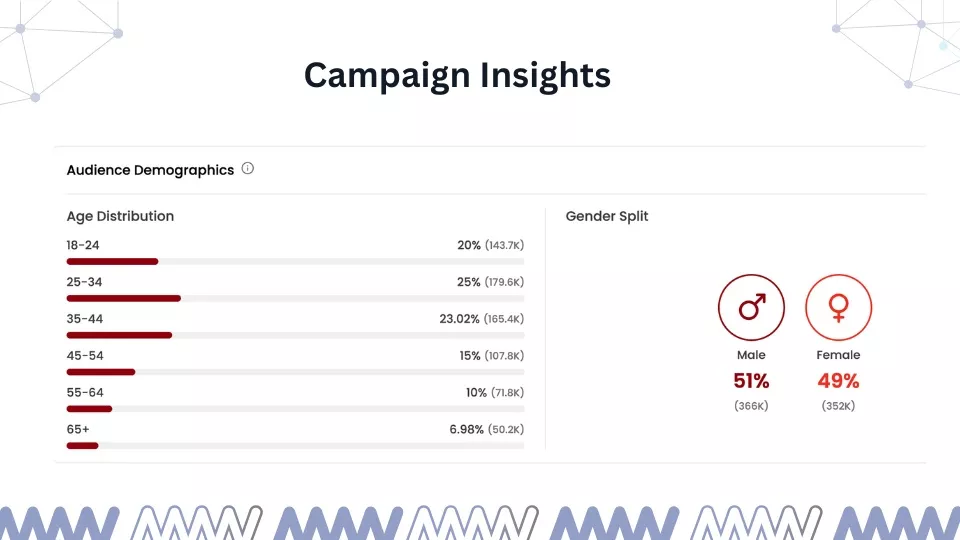
Audience metrics
Audience metrics describe who is being exposed, not just how many people. Modern DOOH systems, like Moving Walls Measure, use aggregated mobile location data combined with census and panel data to build audience profiles around each screen.
- Where people live, work, and travel (e.g., office workers in central business districts, suburban families visiting malls).
- Demographics such as age bands or income tiers, depending on market data availability.
- Behaviors and interests inferred from movement patterns, like “daily commuters,” “frequent shoppers,” or “tech-savvy professionals visiting co-working hubs.”
Performance metrics
Performance metrics show what happens after people are exposed.
- Footfall uplift: Change in visits to your stores or key locations during the campaign compared with a baseline period.
- Website or app traffic uplift: Spikes in direct visits, search queries, or app opens from areas around your screens.
- QR scans, promo code use, or short URLs printed on creatives.
- Store visitation, measured by matching anonymized device movement near screens and later near your outlets.
Together, these metrics help marketers understand not just how visible an ad was, but also how it influenced audience behavior.
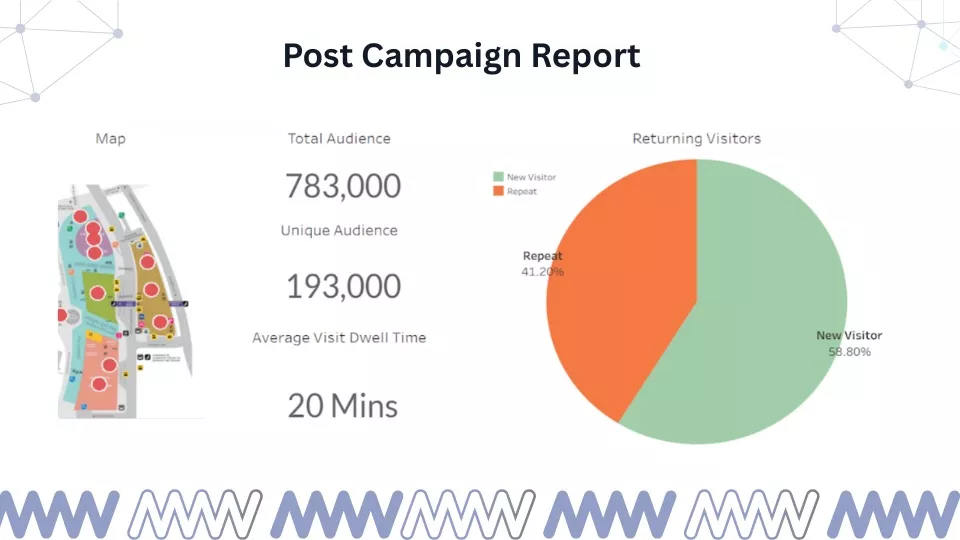
How To Read an OOH Post‑Campaign Report
A DOOH post-campaign report can seem complex, but it becomes easier to decode when you understand key metrics like impressions, reach, frequency, context (where and when the ads ran), and creative delivery.
Impressions & Reach
Impressions measure the total number of times an ad is viewed, which is especially important in DOOH where repeated exposure helps build memory and familiarity. Reach, by contrast, represents the number of unique individuals exposed to the campaign.
- High impressions with low reach = a smaller audience seeing the ad many times.
- High reach with moderate impressions = broad coverage with lighter repetition.
The right combination of reach and frequency can be decided based on your campaign objective and the audience concentration.
Frequency
Frequency shows how many times, on average, someone in your reached audience encountered your ad. In OOH, this matters a lot because people usually see the same screens along their regular routes, on the way to work, in the mall, at transit hubs.
Research shows DOOH delivers strong lifts in ad recall and brand intent relative to other channels, in part because repeated real-world exposure builds familiarity and trust. For brand-building campaigns, a steady frequency can be more valuable than a fleeting one-time impression.
Location context
Not all impressions are equal. Where your ad appears shapes how people process it:
- Airports and metros often mean time-rich, captive audiences with high dwell time.
- Malls and retail areas are closer to purchase moments.
- CBDs and office corridors are ideal for reaching professionals in “work mode.”
A strong report should show performance by location type so you can see which environments were most aligned with your objective (e.g., awareness vs in-store sales).
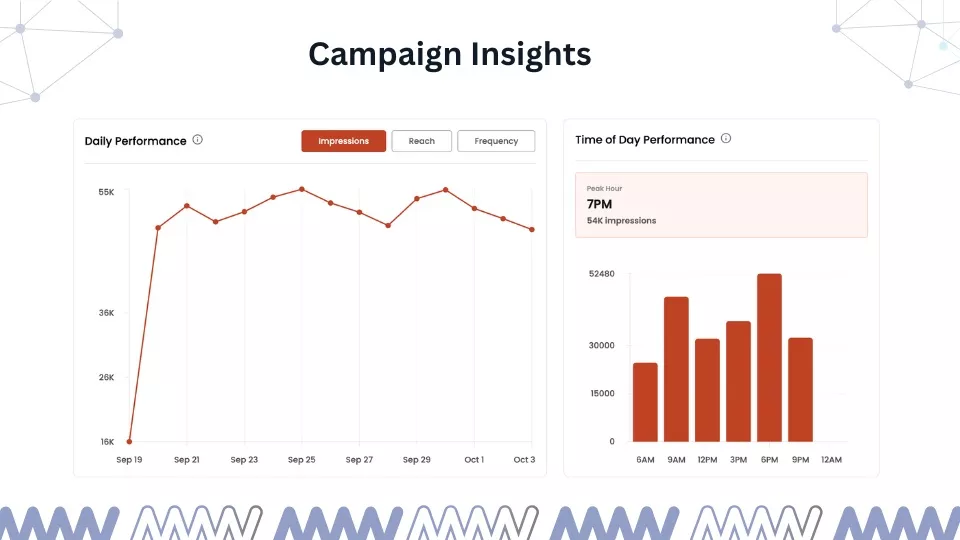
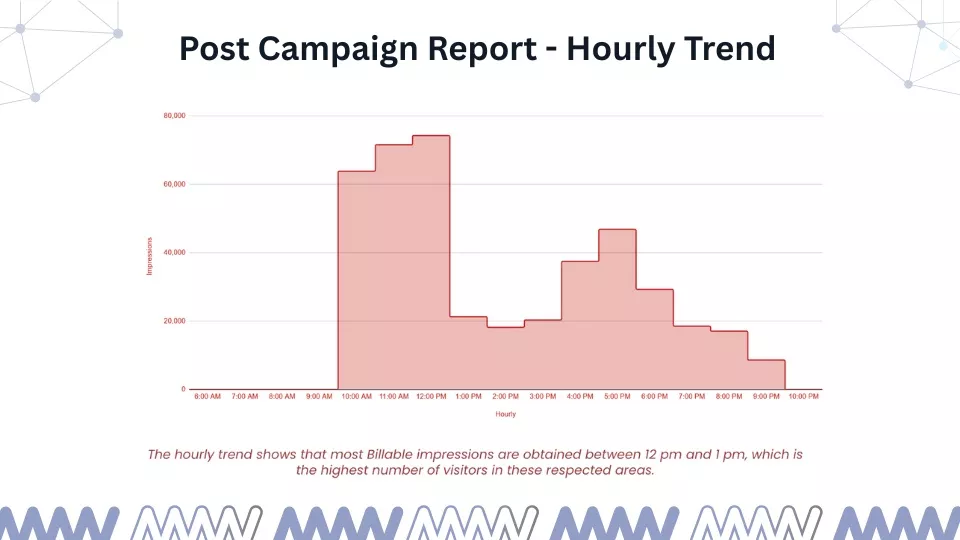
Time-of-day performance
DOOH allows buying and analyzing impressions by hour or daypart rather than only by month or week. This reveals:
- Peak audience windows (e.g., morning commute, lunch, after-work rush).
- Differences in how messages land, an offer seen during “evening unwind” may outperform the same message at 7 a.m.
Time-based buying lets brands dominate specific hours, such as lunch breaks for food delivery or evening slots for entertainment and fintech, and then evaluate performance for those periods.
Creative playback logs
For DOOH, creative logs are like delivery reports in digital. They show:
- How many times each creative played.
- On which screens and at what times.
- Whether there were any missed or over-delivered spots.
Here’s how to decode common patterns:
- “5 million impressions” with low reach and low dwell environments may not be as valuable as fewer impressions in high-dwell, high-relevance locations.
- “High reach + healthy frequency + the right context” is usually where strong brand memory and measurable uplifts start to appear.
From Exposure To Brand Impact: The Gap OOH Couldn’t Fill
Historically, even when DOOH nailed exposure numbers, it still struggled to answer the big questions: Did people actually remember the brand? Did they feel differently after seeing the campaign?
Digital channels solved this earlier with click-based metrics, conversion tracking, and brand lift studies embedded into platforms like Meta and YouTube. Modern marketers now expect similar clarity from every channel, including DOOH:
- Did awareness increase?
- Did usage and preference rise among the right audience?
- Did intent to try or purchase move at all?
This is exactly the gap addressed by Brand Lift Studies within Moving Walls Measure, supported by the intelligence and predictive capabilities of Moving Walls Science.
From Movement To Measurable Brand Lift Studies
Moving Walls Measure provides live audience intelligence, showing who sees your OOH ads, how often, and their audience profile using real-time data on traffic, impressions, demographics, and roadside movement.
Moving Walls Science is an AI-powered intelligence suite that links how people move in the real world with how they think and feel about brands. It combines behavioral research, mobility data, and predictive analytics to give marketers both “before you buy” clarity and “after you run” proof.
How it works in simple terms
- Exposed vs control audiences: Using anonymized mobility signals, the system identifies groups that passed by your OOH placements and comparable groups that did not, creating a natural exposed vs control setup.
- Structured brand lift surveys: These groups are then invited via Brand Lift Studies within Moving Walls Measure to answer short surveys measuring metrics like awareness, recall, usage, preference and purchase intent.
- Uplift calculation: Responses are compared to quantify the percentage lift among people who were exposed to your campaign versus those who were not.
The outcome is a Brand Lift Study from Moving Walls Measure that feels familiar to digital marketers, similar in structure to studies run on major platforms, but grounded in real-world OOH exposure.
What a Full OOH Measurement Ecosystem Looks Like
When everything comes together, OOH becomes a fully measurable, continuously improving system rather than a one-off “big billboard” buy.
Step 1: Plan
Start with audience and location data: identify who you want to reach, when they are on the move, and which environments best match your objective (awareness, store visits, or product trial).
Step 2: Deliver
Run your campaign while tracking impressions, reach, frequency, and playback logs across your selected sites and time windows, ensuring accurate delivery.
Step 3: Analyze
Review exposure, frequency curves, traffic patterns, and engagement signals such as web uplift, app activity, or store visits, looking for peaks by location type and daypart.
Step 4: Evaluate brand impact
Layer in Brand Lift Study results from Moving Walls Measure, supported by insights from Moving Walls Science, to see how perceptions changed among exposed audiences versus controls, whether awareness jumped, recall improved, or consideration lifted.
Step 5: Optimise future campaigns
Use these learnings to:
- Double down on high‑uplift screens and locations.
- Adjust frequency and time-of-day strategy.
- Refine audience targeting and creative messaging.
The brands that embrace full-funnel OOH measurement now will be the ones turning every campaign into a real competitive advantage. With Moving Walls Science, marketers can finally measure OOH the same way they measure online media, from impressions to true brand lift. Start leveraging real-world insights today and see the impact of your DOOH campaigns like never before with Moving Walls.
Scale up your OOH Ads with better ROAS today.